How have the prices of the main commodities evolved?
Which supply and demand factors explain the recent moves?
The assets on the radar in this domain
22 assets scored on the same 14 conditions: 0 with 10+ conditions met, 7 on watch (6–9) and 15 under 6. The scores are those of the frozen snapshot of 29 October 2026 (JSON file with a SHA-256 fingerprint). 10 have a weekly public price in our database.
Concentrated buyers (a few tech companies); credit quality is hard to verify.
#
Condition
Score
In plain words
C1
Real demand
4
Real consumption is weak or falling.
C2
Supply discipline
5
Supply is only partly limited.
C3
Inventories and market structure
3
Inventories are high, so there is no pressure on price.
C4
New uses
7
New uses from technology (AI, batteries, energy, defence) add demand.
C5
Physical vs. speculative demand
4
The price is moved mainly by funds placing bets.
C6
Price transparency
2
The price is hard to find or differs widely between markets.
C7
Supply-demand balance
5
Demand and supply are roughly balanced.
C8
Buyer diversity
2
Few buyers, from few industries.
C9
Irreplaceable
5
Can be partly replaced.
C10
Price vs. production cost
3
The price is far above production cost.
C11
Media (non-linear)
5
Moderate attention.
C12
Price and volume
5
The price is flat.
C13
Crowding (inverse)
8
Few speculators positioned: room for new buyers.
C14
Geopolitical / regulatory risk
4
Production is concentrated in a risky country or region.
Oranges / orange juice · Mature, below peak · 2/14 · Substance being confirmed
Juice demand has been falling for years; citrus greening disease hits orchards.
#
Condition
Score
In plain words
C1
Real demand
4
Real consumption is weak or falling.
C2
Supply discipline
4
Producers produce a lot and do not limit supply.
C3
Inventories and market structure
5
Inventories are at a normal level.
C4
New uses
2
No important new uses are appearing.
C5
Physical vs. speculative demand
7
Bought mostly by those who use it, not only by those betting on it.
C6
Price transparency
6
The price is public, but the market is small.
C7
Supply-demand balance
5
Demand and supply are roughly balanced.
C8
Buyer diversity
3
Few buyers, from few industries.
C9
Irreplaceable
3
Has cheap substitutes.
C10
Price vs. production cost
5
The price is moderately above cost.
C11
Media (non-linear)
3
Press euphoria: a historical top signal.
C12
Price and volume
2
The price is falling with no sign of stopping.
C13
Crowding (inverse)
7
Few speculators positioned: room for new buyers.
C14
Geopolitical / regulatory risk
5
A few geopolitical risks to watch.
Green hydrogen · Emerging · 1/14 · Form without substance
Many projects delayed or cancelled; cost remains far above gas-based hydrogen.
#
Condition
Score
In plain words
C1
Real demand
2
Real consumption is weak or falling.
C2
Supply discipline
3
Producers produce a lot and do not limit supply.
C3
Inventories and market structure
3
Inventories are high, so there is no pressure on price.
C4
New uses
6
A few new uses, still small.
C5
Physical vs. speculative demand
3
The price is moved mainly by funds placing bets.
C6
Price transparency
3
The price is hard to find or differs widely between markets.
C7
Supply-demand balance
4
A surplus is expected: more supply than demand.
C8
Buyer diversity
3
Few buyers, from few industries.
C9
Irreplaceable
4
Has cheap substitutes.
C10
Price vs. production cost
2
The price is far above production cost.
C11
Media (non-linear)
3
Press euphoria: a historical top signal.
C12
Price and volume
3
The price is falling with no sign of stopping.
C13
Crowding (inverse)
8
Few speculators positioned: room for new buyers.
C14
Geopolitical / regulatory risk
4
Production is concentrated in a risky country or region.
Weekly prices (the database)
Every Friday, an automated GitHub routine downloads the closes from public sources and adds them here. Points older than a week are no longer changed, and every update stays in the project’s public history. Last update: 5 November 2026.
Weekly prices of the assets on the radar vs. Commodities (DBC ETF) (index, first week = 100). Source: Radar weekly database (CoinGecko and Yahoo Finance closes), retrieved on 2026-11-05. Each series is rebased to 100 on the first Friday, so assets with very different prices can be compared. The raw prices are in the table and in the source file.
Backtest: what happened before the snapshot
Read with care: the scores were given on 29 October 2026, after this period. The chart shows the context in which the scores were given, not the radar’s performance. Real performance is measured only from the snapshot onwards (next section).
Median change in the 8 weeks before the snapshot, by zone (%). Source: Radar weekly database (CoinGecko and Yahoo Finance closes), retrieved on 2026-11-05. Computed automatically from the database: 4 September 2026 → 30 October 2026. In brackets, the number of assets with a public price in each zone.
Computed automatically: in the two months before the snapshot, 2 of 10 assets with a public price rose. The median change was -14.5%, against +5.4% for Commodities (DBC ETF). The largest rise: Sugar (+7.1%); the largest fall: Rare earths: NdPr (oxide) (-33.9%).
Since the snapshot: the radar’s performance
The first measurement runs automatically on Friday, 6 November 2026, against the close of 30 October 2026. From then on, the table above and this paragraph update weekly, with all assets, including those that fell.
Past performance is not a reliable indicator of future results. Prices before fees and taxes. This is not investment advice.
How we apply the 14 conditions here
The same algorithm as for crypto, companies and commodities: each condition gets a score from 0 to 10 and is met from 7. The weights are identical in every domain; only what we measure in practice changes.
#
Condition
What we measure
Weight
C1
Real demand
Real, growing physical consumption, not just a story.
16%
C2
Supply discipline
Producers or states limit supply (quotas, cuts, export controls).
6%
C3
Inventories and market structure
Low and falling inventories = high score.
6%
C4
New uses
New demand from technology: AI, batteries, energy, defence.
8%
C5
Physical vs. speculative demand
Bought by those who use it, not only by funds betting on it.
6%
C6
Price transparency
Public price, liquid exchange, reliable data.
8%
C7
Supply-demand balance
Expected deficit = high score; surplus = low score.
8%
C8
Buyer diversity
Many buyers across different industries.
4%
C9
Irreplaceable
No cheap substitutes.
6%
C10
Price vs. production cost
Price close to production cost = room to rise.
6%
C11
Media (non-linear)
Balanced attention; media euphoria signals a top.
6%
C12
Price and volume
Steady price with growing demand = good sign.
6%
C13
Crowding (inverse)
Few speculators positioned = high score.
6%
C14
Geopolitical / regulatory risk
Production concentrated in one country = low score.
Energy: a price shock in Europe, but not in the US
In September 2026 Brent crude reached USD 116.8 a barrel, 69% above its 2025 average. European gas rose to USD 25.42/mmbtu, more than double its 2025 average, while US gas (2.95) is even below last year’s average. The gap between the two markets widened from about 3.4 times in 2025 to 8.6 times.
Based on: Brent crude oil; Natural gas: US (Henry Hub) vs. Europe
Metals: copper and silver lead
Compared with the 2025 average, copper is up 45% (USD 14,474 a tonne), silver 62%, platinum 40% and gold 26%. Gold now costs more than twice its 2023 price. Nickel (+8%) and iron ore (slightly down) lag behind: their supply is abundant.
Based on: Industrial metals: copper, nickel, aluminium; Precious metals: gold and platinum; Silver; Iron ore
Agriculture: grains rise, cocoa and oranges fall
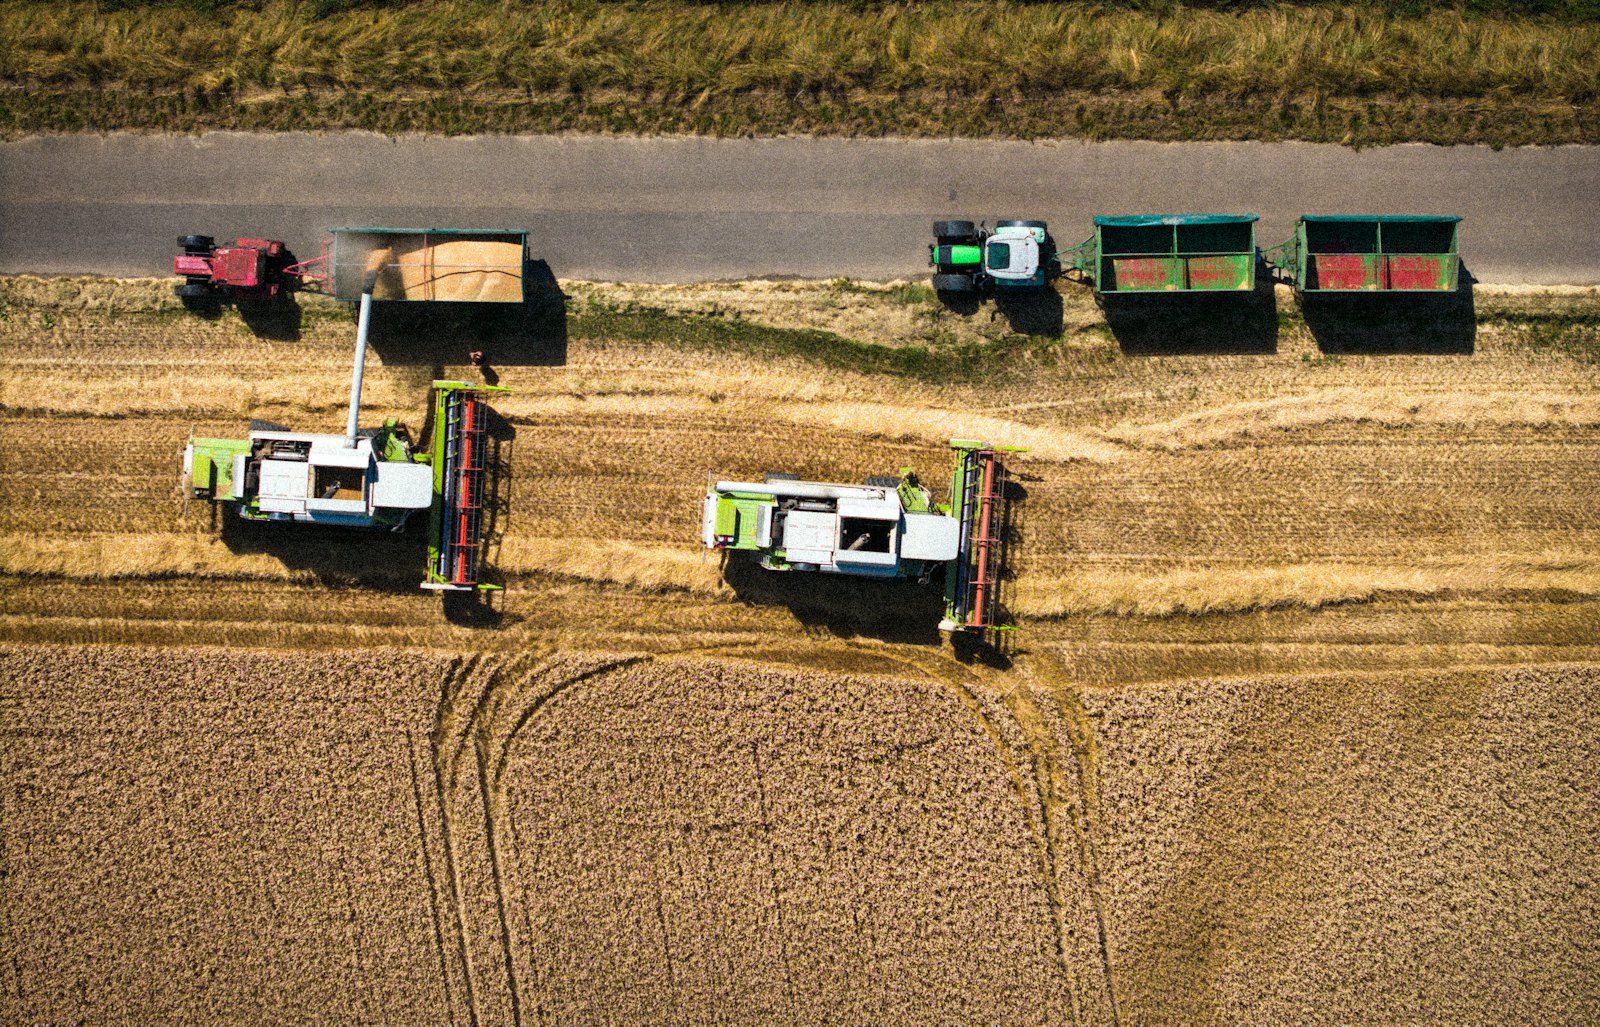
US wheat is 43% above its 2025 average and corn 18%. In the other direction, cocoa has fallen 24% after the peak of the 2024 crisis, and oranges are at about a third of their 2024 average. Agricultural commodities can move sharply in both directions within a few months.
Based on: Grains: wheat (US, HRW) and corn; Cocoa, Arabica coffee, sugar and oranges
Questions about the reasoning
Do you disagree with a score, or want to know why an asset is where it is? Ask. We answer with the weekly update, with sources, by email and, if you agree, here on the page.